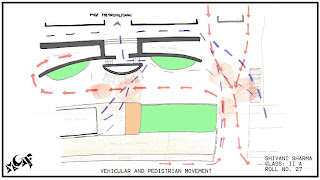
picture 1:vehicular and pedestrian movement
red arrows: vehicular movement
blue lines: pedestrian movement
orange areas: areas having head on collision of pedestrian and vehicular traffic.
NOTE : no specified path for pedestrian traffic.
Heat Chart : normal timings
picture 2: heat chart at normal timings
red: most populated areas
orange : medium populated
yellow: negligible population
Heat Chart: During flash mob
picture 3: heat chart at the time of flash mob
red : most populated areas ( place of flash mob)
red doted: areas from where people are attracted towards flash mob area.
Pshychological reaction
picture 4: psychological reaction during flash mob
blue dots: site of activity during flash mob
pink lines : people only visually involved.
blue lines: people who actually came and participated by painting the structure.
NOTE: only people from metro station participated
Problematic Areas
picture 5:problematic areas
green: unused green spaces
brown: muddy service lane baricated by mgf mall authority.
yellow: muddy patch left
red :head on collision of vehicular and pedestrian traffic ( no particular path for pedestrian people)
blue: con-justed entrance ( no recognizable entrance)
NOTE: even no shade and no seating


No comments:
Post a Comment